Choosing a final approach to a problem individually and especially with a large group of people can be incredibly difficult. A Decision Matrix is a great tool to help think through which solution options do the best job of meeting a complex set of requirements. I have used this for platform selection on multi-million dollar programs where alignment between several businesses and functions within those businesses was critical.
The 5 Sentence Splash: Quick Summary of the Tool
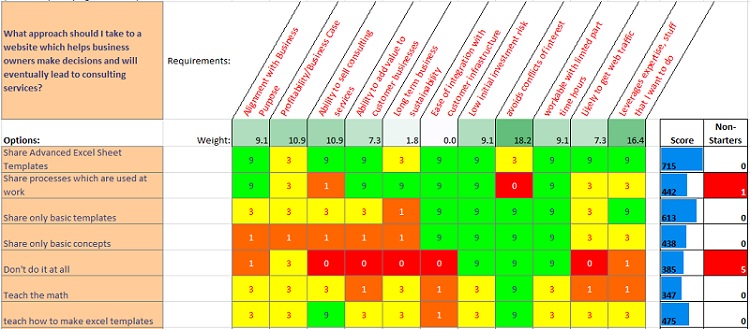
First, we develop a list of requirements and importance weight of those requirements which is listed along the top of the matrix. We then list the options to meet those requirements along the left side of the matrix. In the center, we use a ratio scale (0,1,3,9) to rank how well the options on the left do against the requirements on the top. The tool then helps us score which options best meet the combination of requirements by scaling the scores via weight and adding them up. The final result should give you some visibility to the top options and relative capability to meet the requirements.
What Do We Get Out of This?
Highest Relative Score for the Best Options
This tool is very good at helping you see what the top-ranked options are and the relative difference in capability of the options. In some cases, I’ve seen this tool show that there is an obvious winner, but I’ve also seen this tool show that there really isn’t much to differentiate between the top two or three options.
Urgency vs Importance
In some specific cases, I have seen decision-makers over-emphasize urgent requirements over important requirements in their selection of a solution to a problem. This tool helps give appropriate weight to important items which aren’t as urgent.
Getting Group Alignment
This is a powerful tool for individual use and for group use. I recommend filling in the sheet individually first and then review with a large group of key stakeholders to get their input and agreement on the requirements and scoring methodology. I’ve done this with up to 25 experts from various engineering functions and businesses. Presenting the results of the group scoring consensus to the executive team really helped demonstrate that each group’s concerns were represented. In this case, it is best practice to list all of the participants of the scoring at the bottom of the matrix for sharing.
How To:
Load up the Template:
This template includes a Pairwise Comparison worksheet and a Decision Matrix worksheet. We’ll be using these two in conjunction in this example. You don’t HAVE to use them together, but they compliment each other very nicely.
Decision Matrix Template Download
Requirements and Importance Weights
We’ll be using a Pairwise Comparison to put weights behind the requirements used to choose your top options. In pairwise comparison, you start with a list of options, preferably between 5 and 12 options for best use of the tool. Each option is compared to every other option on the list and you vote for the one which is more important. The option with the most votes is the highest priority and so on. I have a full blog on how to use this tool here: Pairwise Comparison so I won’t go into full detail on how to use this portion of the sheet.
Examples of business requirements you could use:
- Business profitability (NPV and ROI)
- Engineering resource availability
- Funds availability
- Shortest Payback period
- Regulatory compliance
- Product Reliability (low failures/warranty)
- Product Durability (lasts as long as expected)
- Customer Total Cost of Ownership
- Customer Desirability
The output of the Pairwise Comparison is linked to the Requirements section of the Decision Matrix worksheet. Scroll to the “Extensions” section if you’d like to use a different (potentially simpler) method for determining your requirement weights.
Decision Statement
In the top left of the “Decision Matrix” sheet fill in your Decision Statement. This should be a question that illustrates what you’re trying to narrow these options for. I’ll list a few examples to get your motor started:
- What platform should I use as the basis for this new product?
- What are the most important things to accomplish in my new business?
- What new program is the most important to launch this year?
- Which approach to this problem will have the lowest risk?
- Which proposal is my client most likely to accept?
List Options
List your options along the left side of the Decision Matrix. I have found that if you are talking about a product, it helps to put small images representing the product in the box with the option title.
Score Options Against Requirements
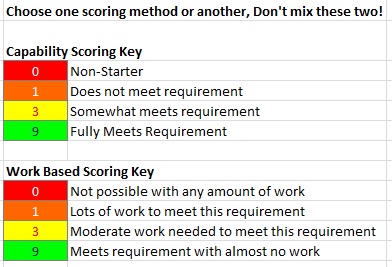
This scoring is the core of the tool. You will notice two ratio scaling keys on the right of the tool with 0,1,3,9 as options. Before you start you should choose one of these scaling definitions and stick to it. Switching between them causes confusion and inconsistent results.

Use these numbers to score how well the options on the left meet the requirements on the right. You can see that the template shows the relative weight of the requirements along the top. Make sure you focus your discussion on the highest weighted items and they will drive the most points in the final scores. Non-Starters should be reserved for when an option violates a requirement so much that it should disqualify an option from consideration no matter how well it does against other requirements.

Using the Results
After the matrix scoring is complete you will see a scoring result on the right side. You can see that there are two primary considerations, one is the overall SUMPRODUCT of the scores with the weight of the requirements and two is the occurrence of “non-starters”. The option with the highest score has the best overall capability to meet the combination of weighted requirements. In some cases a Non-Starter could be overlooked, that is up to the discretion of the users.
I have seen on occasion that the top two items come out fairly close to each other. If the relative difference between one score and another is minimal then you may need to further define requirements or look for some other metrics or methods to choose a primary path. Ideally, you’ll see at least 10% separation between the best score and the next best alternative.
When presenting the matrix after completion, it is a good idea to hide the rows and columns that don’t have values in them.
Extensions:
Simple Requirements Weights
Many applications of the Decision Matrix tool don’t use Pairwise Comparisons to help determine weights of requirements. Often times users will prefer to just list the requirements across the top and score the weights starting with the most important at 10, next at 9 and so on. This often takes less time if you’d prefer not to go through scoring in the Pairwise Comparison.
Additional Score Resolution
In some cases, you need more resolution between a 3 and a 9 on the scoring scale. On occasion, I have had to add a “6” as an option to differentiate between 3 and 9. This could be defined as “Mostly meets requirements” on the capability scale or “Light amount of work needed to meet this requirement” on the work based scale. If you insert cells (shift cells down) between the 3 and 9 row in the capability key, you can add a 6 with a definition and the template will allow you to use a 6 in the matrix. If you’re using the work based scale you still need to add a 6 to the capability and the work based scale to make it an option in the matrix.


Great write-up, I am regular visitor of one’s blog, maintain up the nice operate, and It’s going to be a regular visitor for a lengthy time.