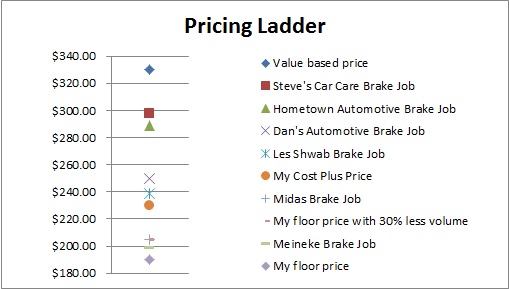
Pricing ladders are a very simple but powerful visual tool to use when analyzing pricing. We used a ladder already in Market Based Pricing because it is the best way to look at the marketplace and the majority of the data points you include on a ladder will likely be from market-based sources. We’re going to use exactly the same template here, but we’ll add some additional data points to the ladder.
The 5 Sentence Splash
Pricing Ladders visually stack price options relative to each other. Most pricing ladders use only the vertical axis of a chart to display all of the options included. Pricing ladders should include prices from Cost Plus, Market Based and Value-Based pricing (if completed) and should also include what is called a “floor price” which is the lowest price your business is able or willing to sell the product at. With this basis, we can include additional analysis points such as specific business scenarios or points of interest from a Sensitivity Analysis. Once the ladder is complete, it is easy to gain a feel for what pricing is realistic and if the business can be profitable and realistic for you to compete.
Use the Template
Here it is again in all of it’s simplicity. Simply enter the item and the price and the template does the rest of the work for you. My gift to you.
Pricing Ladder Download

Floor Price
This is really up to you to determine what your lowest price is. Don’t get greedy when setting this. This should be your, No Kidding, lowest price you’ll go. Now, DON’T put that on a chart the customer might see! In many of my business cases which have used hurdle rates I’ll grab the breakeven price and put it on the ladder as a proxy to the floor price. In some companies the floor price is a management-approved price which they use their own criteria and process to determine.
Scenario and Sensitivity Analysis
When doing Scenario Analysis and Sensitivity Analysis you’ll start to see that there are some common scenarios or factor which you worry about a lot. This is a great place to include those more pessimistic scenarios. One company that I’ve seen includes a 50% volume reduction scenario in just about every product plan. I’d put that on the ladder, just so it’s clear.
You could also have different prices based on different volumes. In this case you should use a specific ladder just to describe those pricing steps.
Avoid the Clutter
I’ve had lots of times that these ladders get really cluttered up. I’ve had to split the upper and lower range of a ladder into two. You can split market based from internal based but include one or two critical crossover points. The whole point of this chart is visualization. If the clutter stops that from being possible then clean house! Sometimes you just need to change the scale of the vertical axis. Just double click on the price axis and use the “Axis Options” chart feature in excel to change the min and max until it looks right.


